self serve data transformations
Uploading and transforming data to fit it into a new system is a complicated and cumbersome job, even for data professionals. Vena users had relied entirely on white-glove onboarding to get their data into the system due to the complex nature of the task, which led to long TTV timelines and a lack of customer understanding of how the platform really works. I led the design of an ambitious leg of a program to redesign Vena’s data implementation process to empower finance professionals to transform their data on their own with the support of an intuitive interface and thoughtful guardrails.
THE CHALLENGE
enable new users on our most complex tool
This project was a milestone initiative within a larger program to make a customer-led tenant implementation possible in order to reduce time to implement and empower customers to do more in the product.
This specific step; data transformation, was crucial to get right in order to not have negative repercussions for the user’s entire implementation, but was also possibly the most complicated tool to use within the product.
MY ROLE
I worked as the lead designer on this project and on the Quick Start Program as a whole, collaborating with 1 other designer who was leading Step #3 of the program.
I worked closely with a Product Manager, Engineers, UX Researcher, Content Writers, as well as internal subject matter experts throughout the project’s lifecycle, including Account Managers, Solution Architects, and CSMs.
I led the design for this project from Sep 2023 - May 2024, releasing the project in April 2024, at which point I stepped away from the project for another initiative.
FIRST THING’S FIRST
what is a data transformation?
Every customer has to use Vena’s data transformation tool to clean & map their data fields from their spreadsheet into Vena’s “data cube”. Basically, we need to know that the user’s spreadsheet field called “Business_Unit” means Account in Vena.
A customer’s existing dataset needs to be adjusted so that fields that combine multiple pieces of data are split out, re-named, and mapped to the appropriate field in Vena.
This process was always handled by Vena’s internal consultants due to the complexity and risk of errors that could completely ruin their solution forever. Yup, big risk.
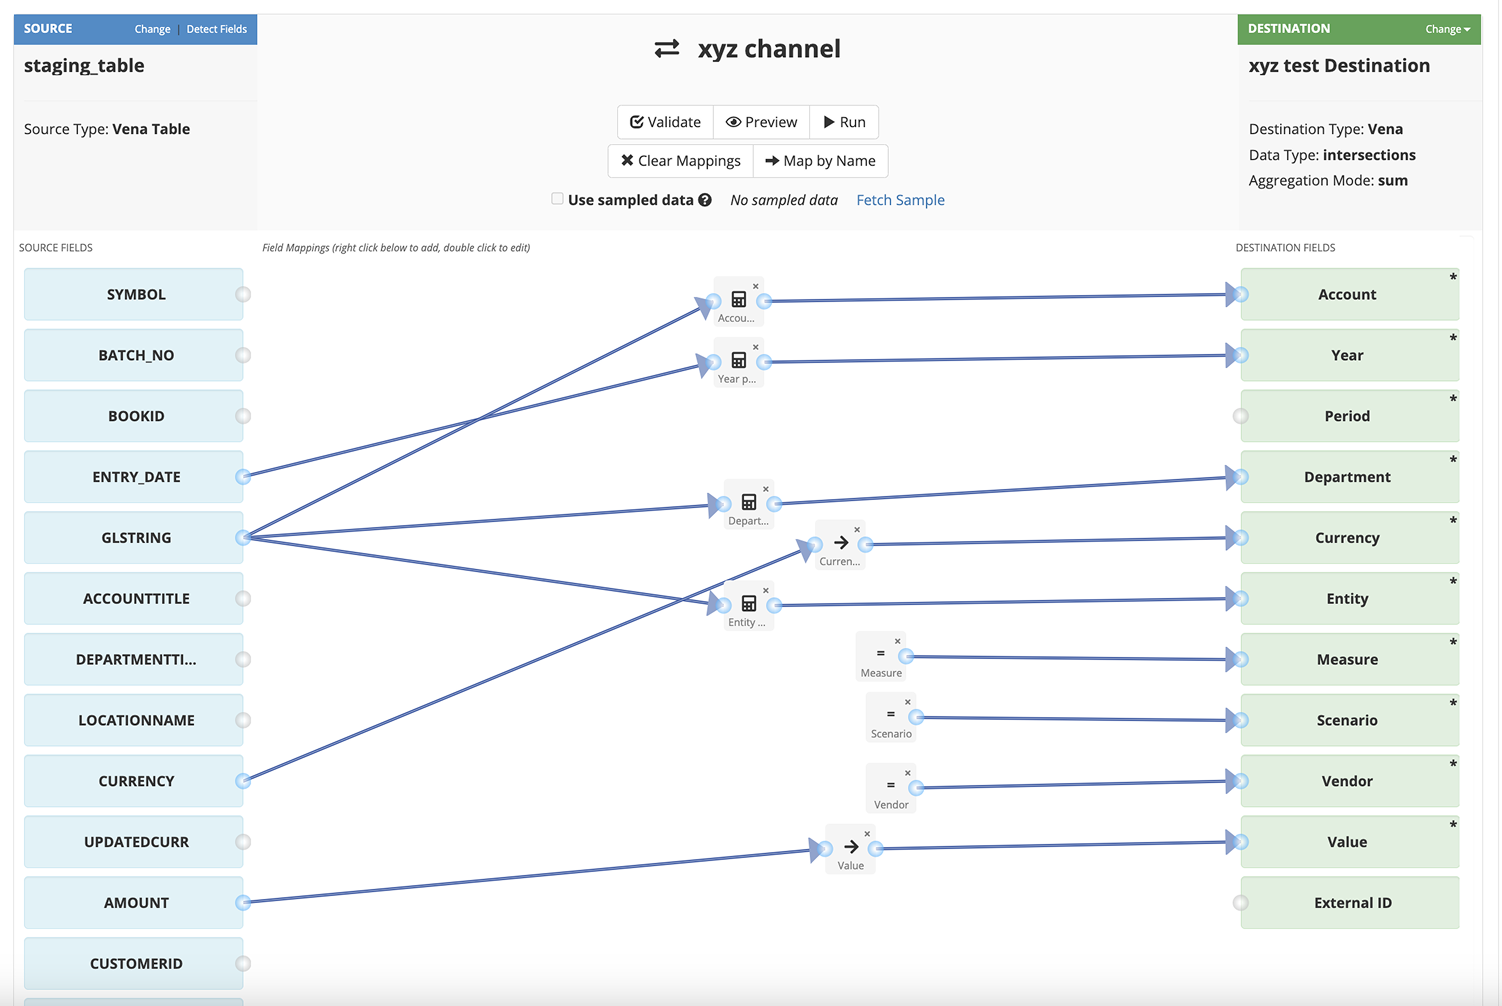
Data mapping tool in Vena
The existing data mapping tool was complicated and unintuitive for customers due to the lack of any visual or instructional guardrails, and the chaotic nature of the flow.
![Edit Formula Mapping modal using =right(input['GLSTRING'],4) to extract the final four characters of a GL string](/__l5e/assets-v1/8c6d3a59-134e-45c4-872a-5a744df7326d/diy-old_splitting_tool.png)
Data splitting tool in Vena
The data splitter tool was also equally challenging to use as it relied on the user knowing Excel formulas and being able to apply them correctly.
DISCOVERY
establishing a baseline
I tested an early concept prototype with 4 newly implemented customers via 60 minute sessions in order to understand the following:
- How familiar are new users with the concept of data transformations?
- Do users understand why data transformations are required in Vena?
- Could users complete the required data transformations using the prototype provided?
- What verbiage resonates best?
I decided to begin with a usability session so that I could get a baseline of how our customers understood data transformations that would inform the design direction and the amount of support that we’d need to build in.
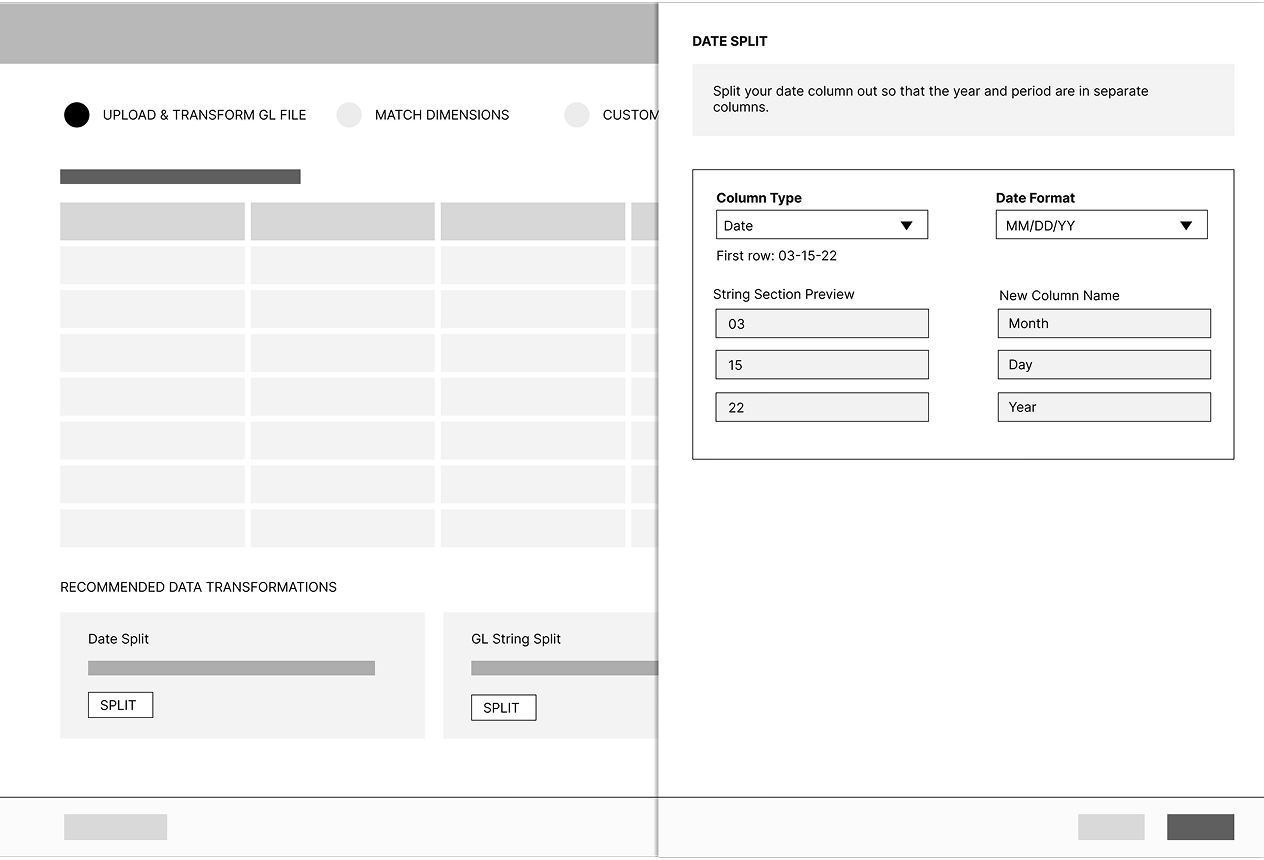
Early wireframe
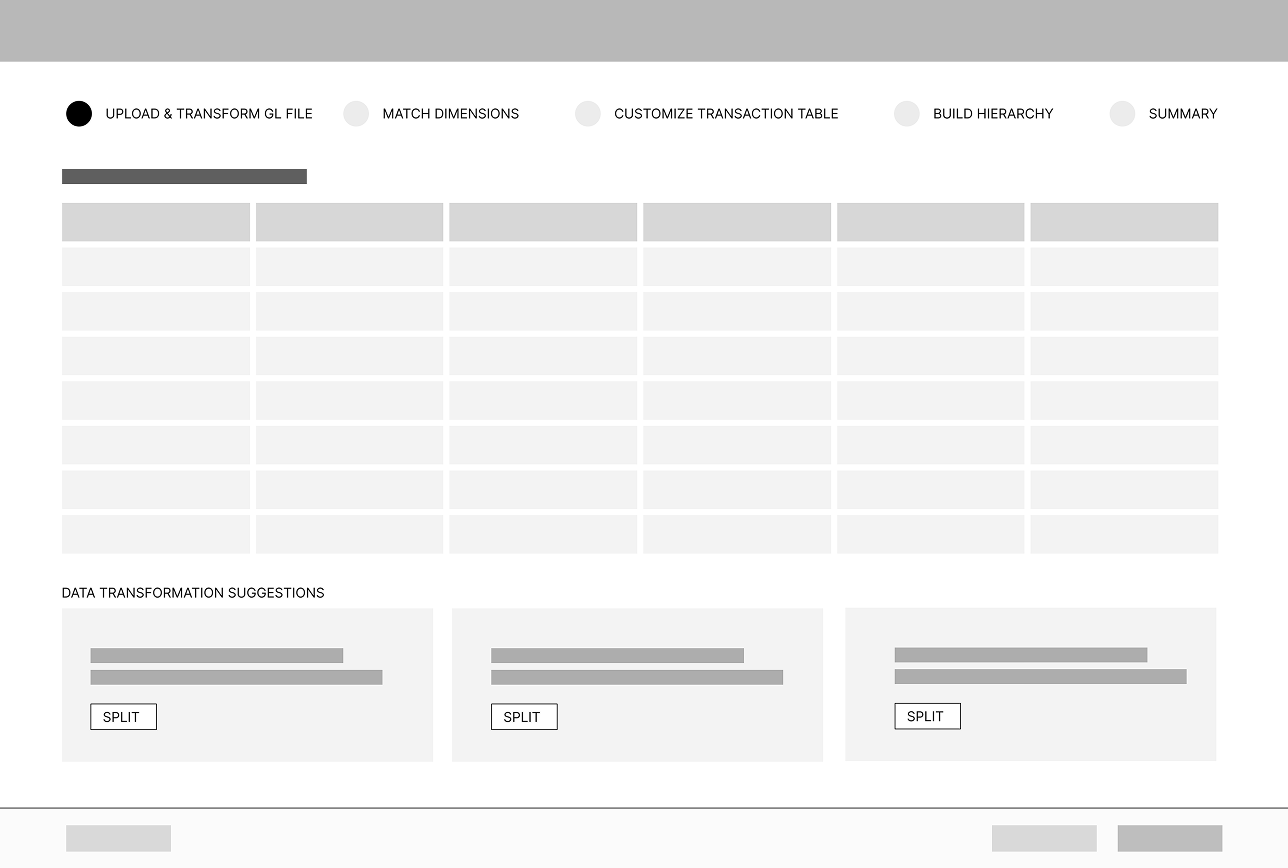
High fidelity prototype
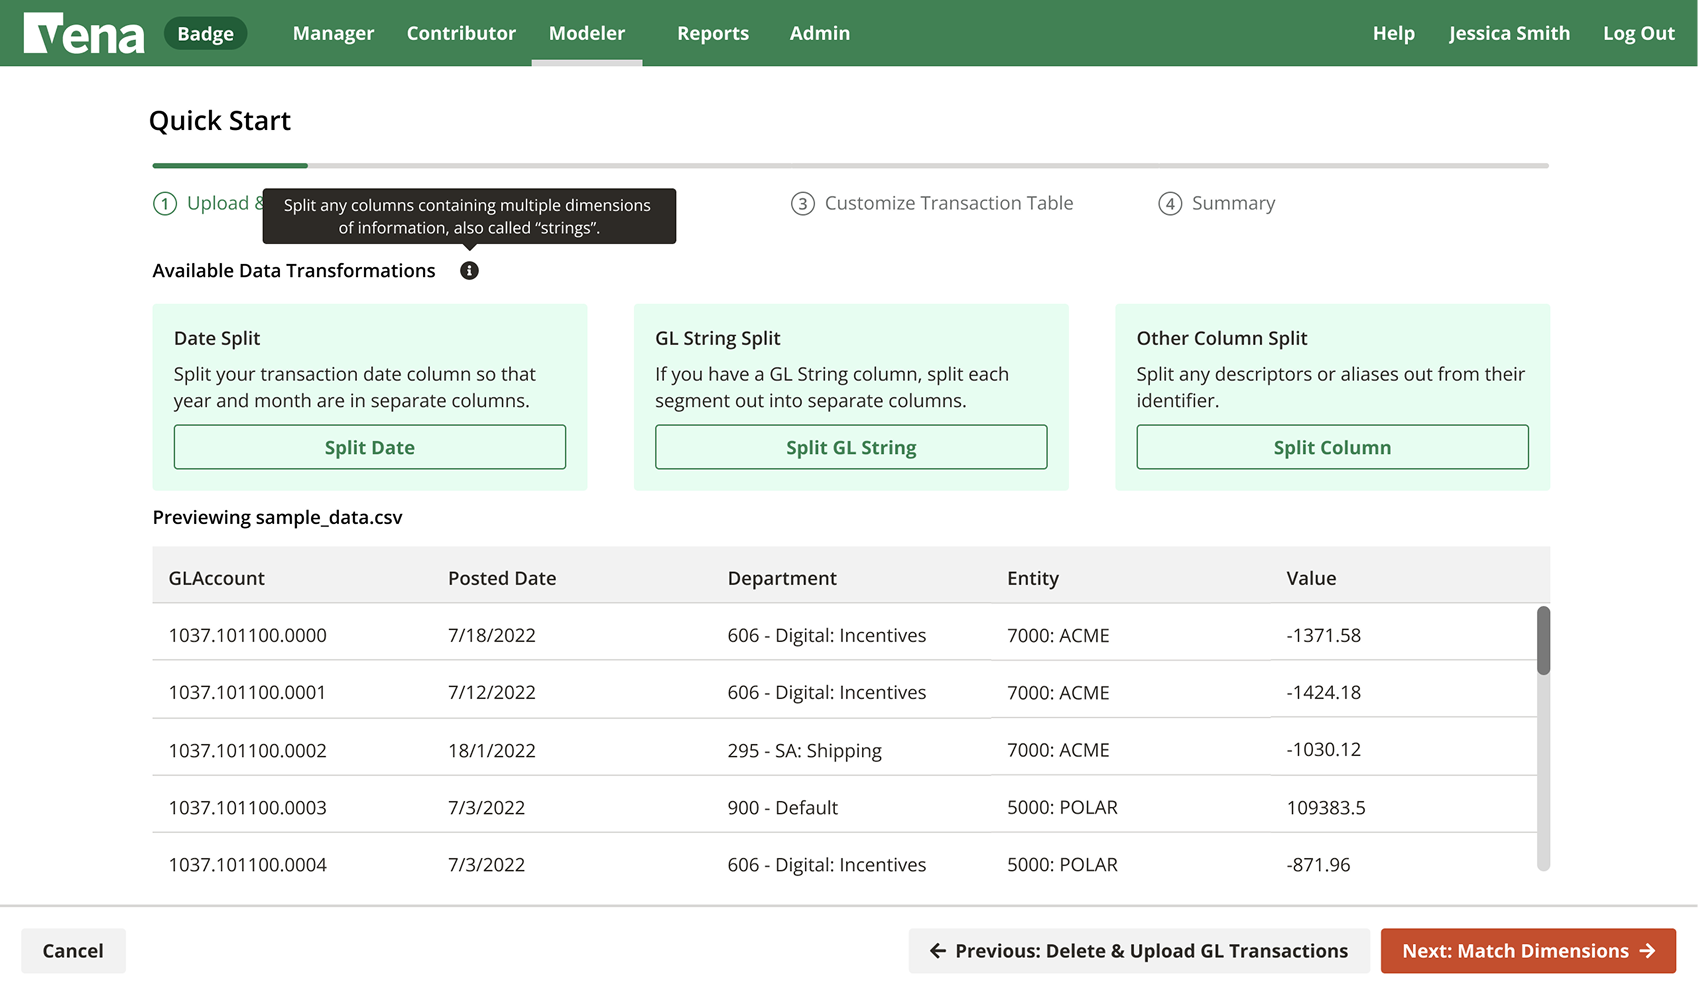
Suggested transformation types early wireframe to high fidelity user testing prototype
Early wireframe
High fidelity prototype
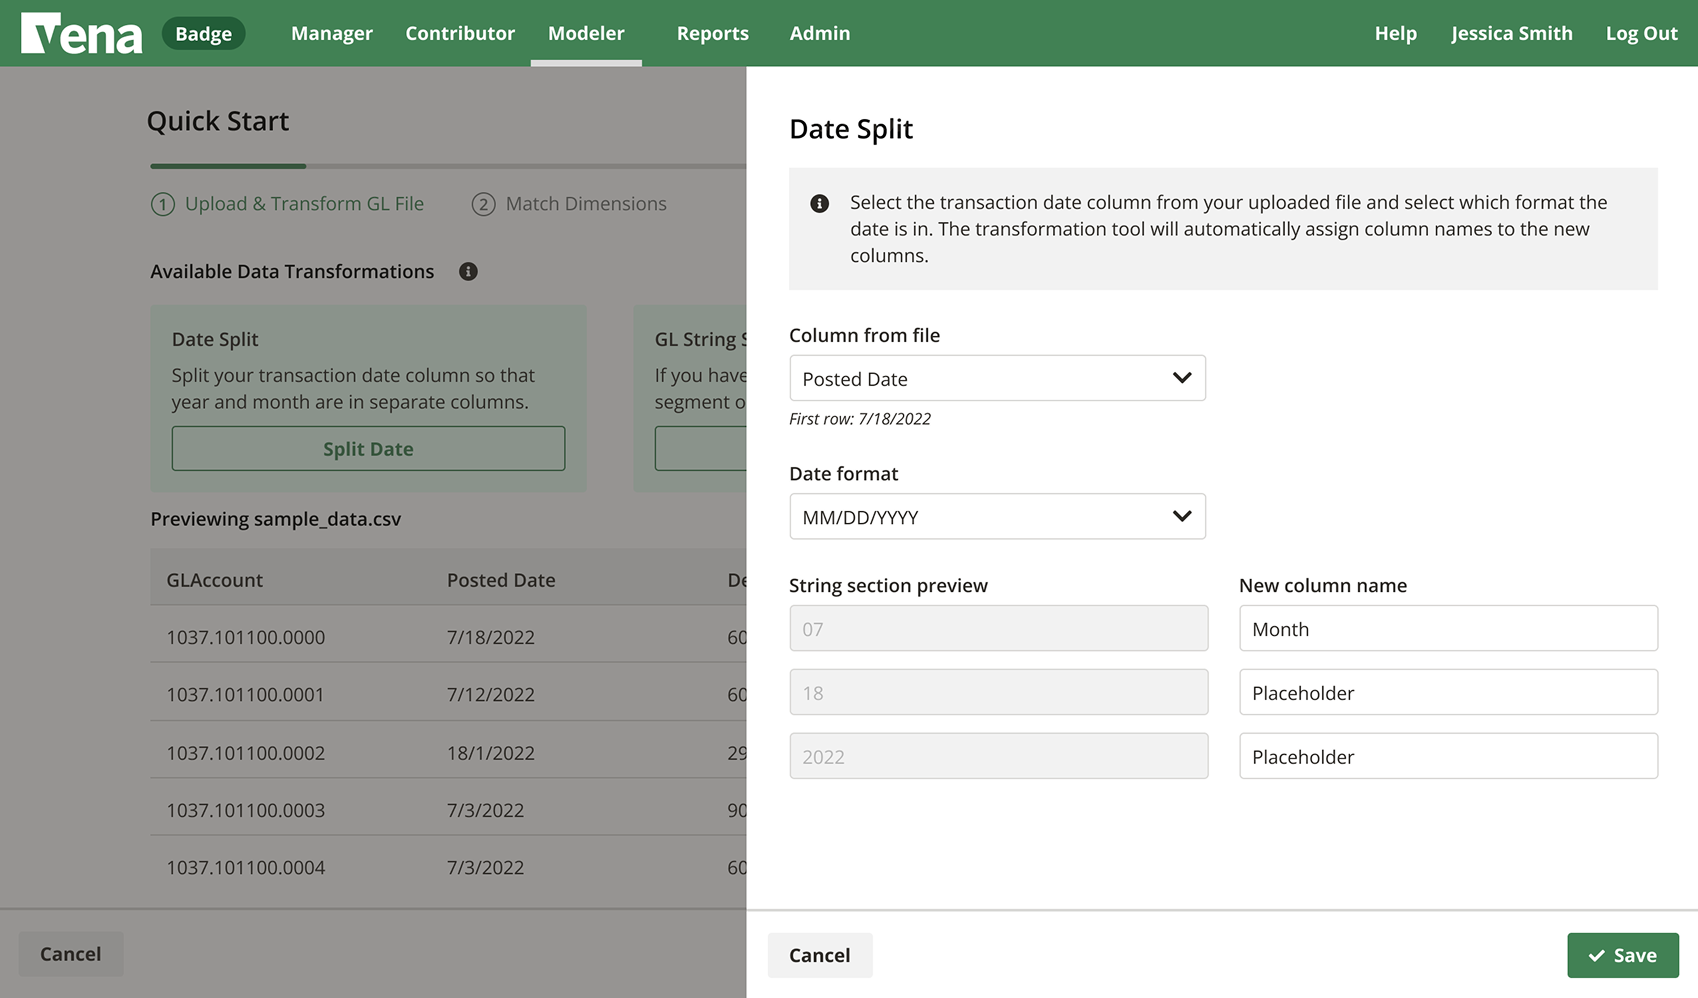
Split column drawer early wireframe to high fidelity user testing prototype
FINDINGS
users need guardrails because users don’t read
Many of the test users quickly scanned the page and determined they could move forward. When I dug into why, they believed the green boxes meant that everything was complete and since they also thought their data was already perfect, they quickly clicked Next which resulted in no data transformations.
“I know that I need to manage my periods and my years separately because I'm a Vena user and I understand the way that dimensions work. That is not something as a step one that I think that any user would would understand.”
This led me to conclude that users need very structured guidance and stricter guardrails to ensure they complete the necessary steps in the task rather than leaving it up to them to determine which steps were relevant.
USABILITY TESTING
users don’t know their data, and users still don’t read
I conducted another round of usability testing with a new prototype which was based around the customer identifying the format of their data so that we could instruct them on the data transformations that would be needed.
However this series of usability tests revealed that users were just so unfamiliar with the concept and terminology of data transformations that they couldn’t properly identify their current data or successfully complete a column split. They also often skimmed and misinterpreted the questionnaire, resulting in poor data.
Another unsuccessful approach that ultimately led to the fool-proof designs...
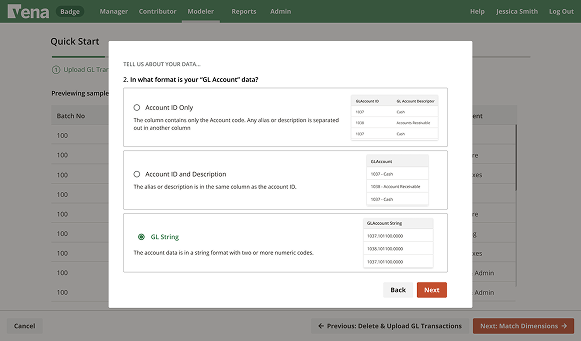
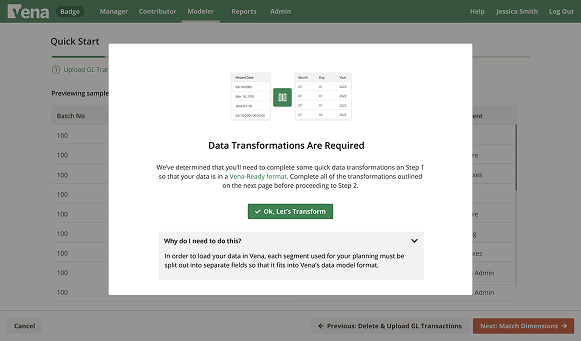
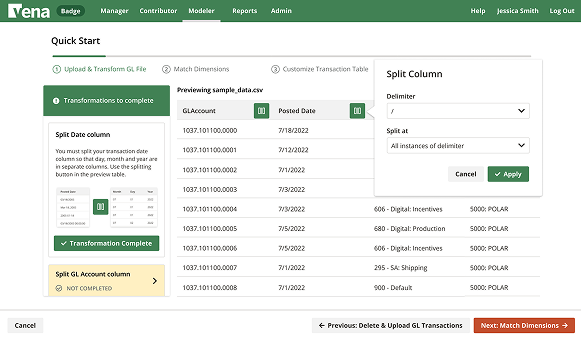
Prototype screens for usability testing the Data questionnaire approach
THE REFRAME
fit your data into vena’s mould
The approach we’d taken so far where we’d relied on users to self-identify what transformations their data needs clearly wasn’t working.
We needed to change our approach and install some bumpers.
I made a big bet by advocating strongly for merging the transformation step with the next step in the process in which the user must match their data columns to one of Vena’s data dimensions (i.e., the column called “Business Unit” maps to Vena’s dimension called “Account”).
My new designs were founded on the principal that the user would be much more likely to complete the key data transformations correctly if they were forced to match a column to each of Vena’s financial dimensions.
FINAL DESIGNS
users love guardrails
Based on all of the previous feedback, I designed and usability tested a new version of the tool which leveraged a drag and drop interface followed by instructions to split their data columns if needed.
Customers intuitively understood the drag and drop functionality and resonated with needing to transform columns that were matched to multiple financial dimensions since it was visually clear that each column could only contain one dimension.
STEP 1: MATCH VENA’S DIMENSIONS
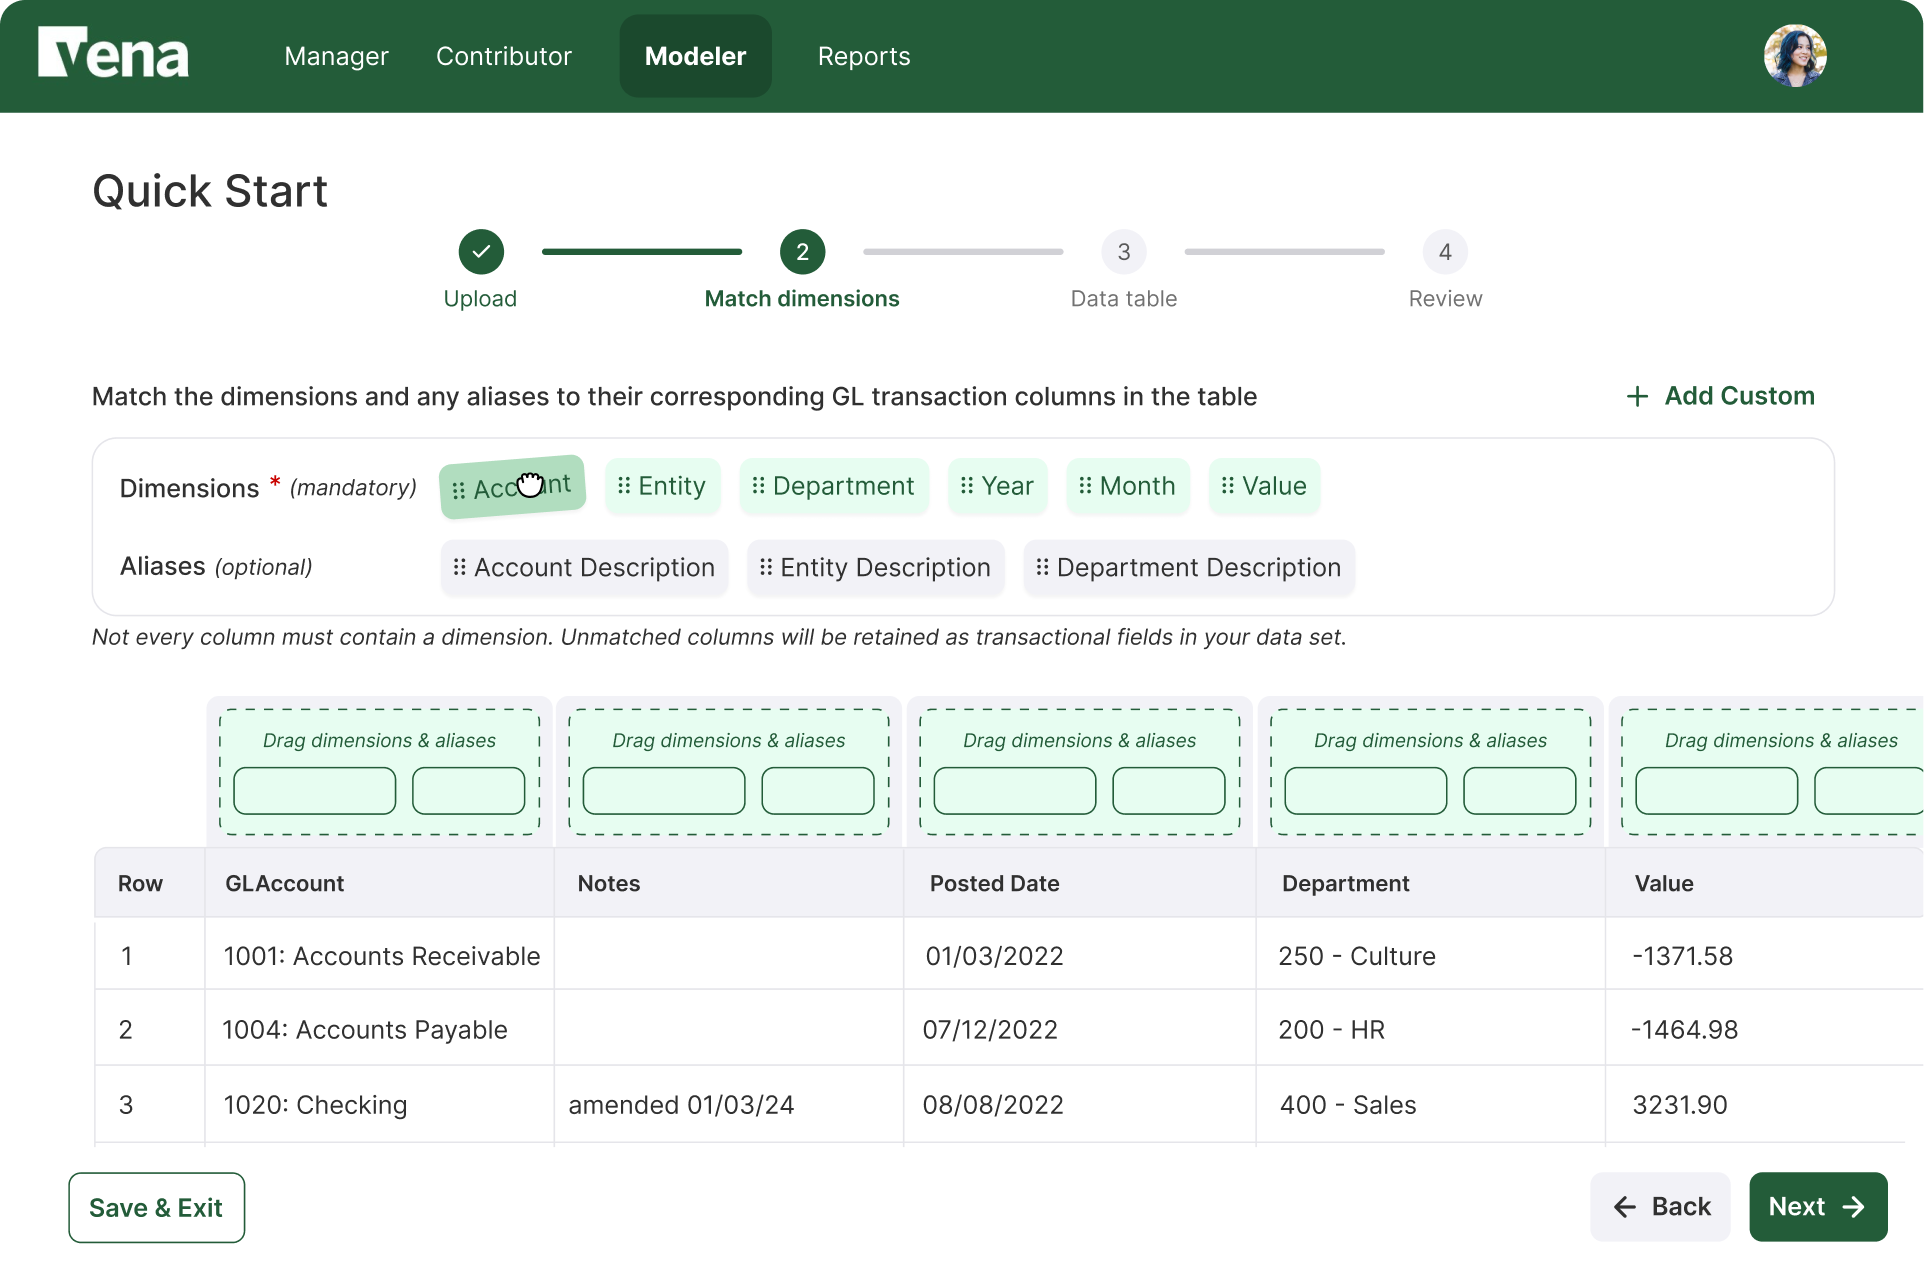
In order to force users into ensuring their data fields were properly formatted for Vena’s key data dimensions, I utilized a drag and drop pattern. This left no room for error as all of the mandatory dimensions had to be matched before proceeding, which would highlight any key data issues.
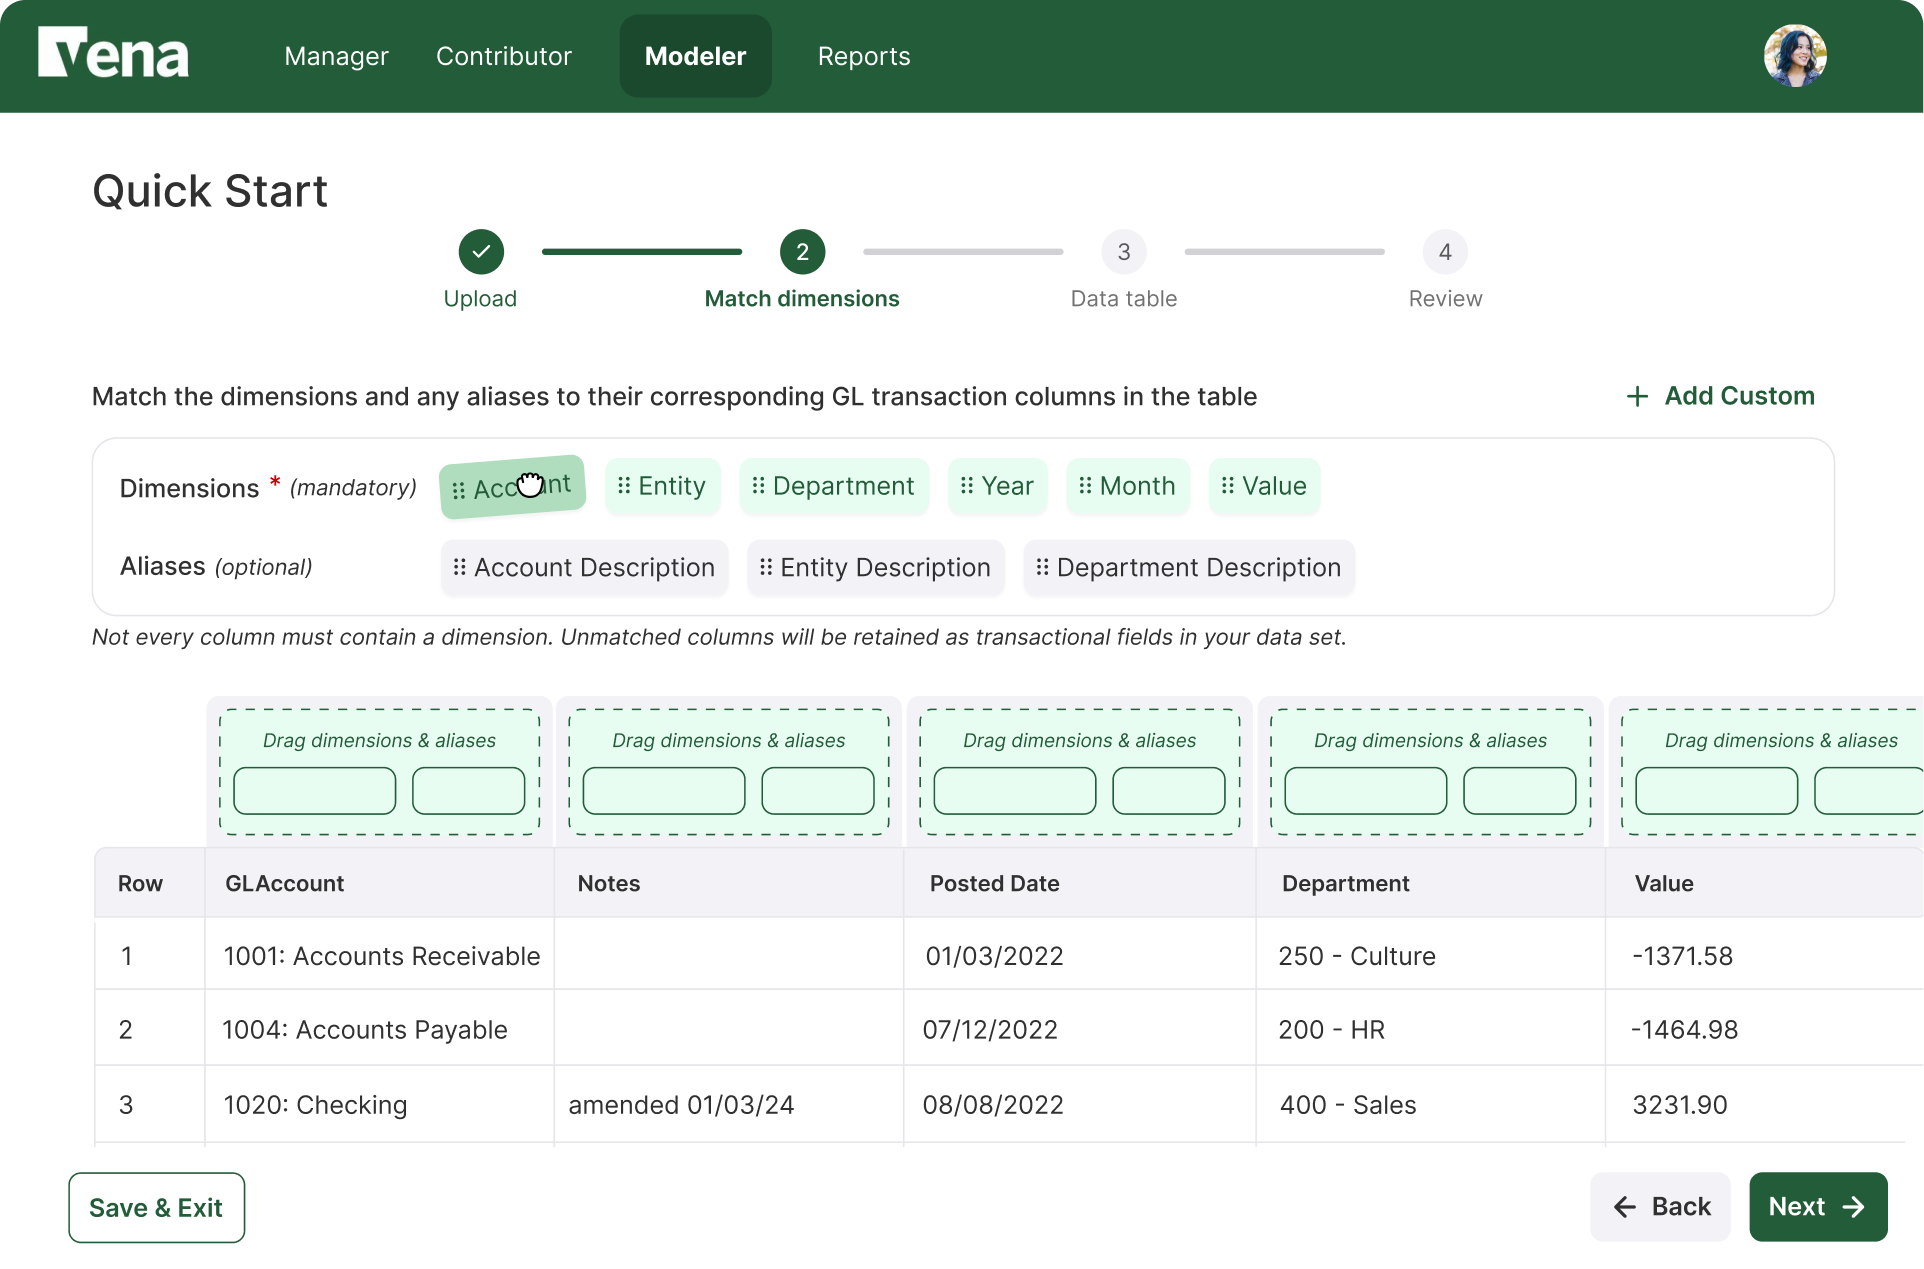
Providing the list of mandatory dimensions to match before the user could proceed provided us with success criteria for this step. Once all required dimensions were matched to a unique column, the user could proceed.
Drop zones light up when dragging chips to signal intended behaviour. The use of skeleton chips also visually communicates the ability to drag multiple chips into one box.
Drag dimensions and aliases into their corresponding table columns.
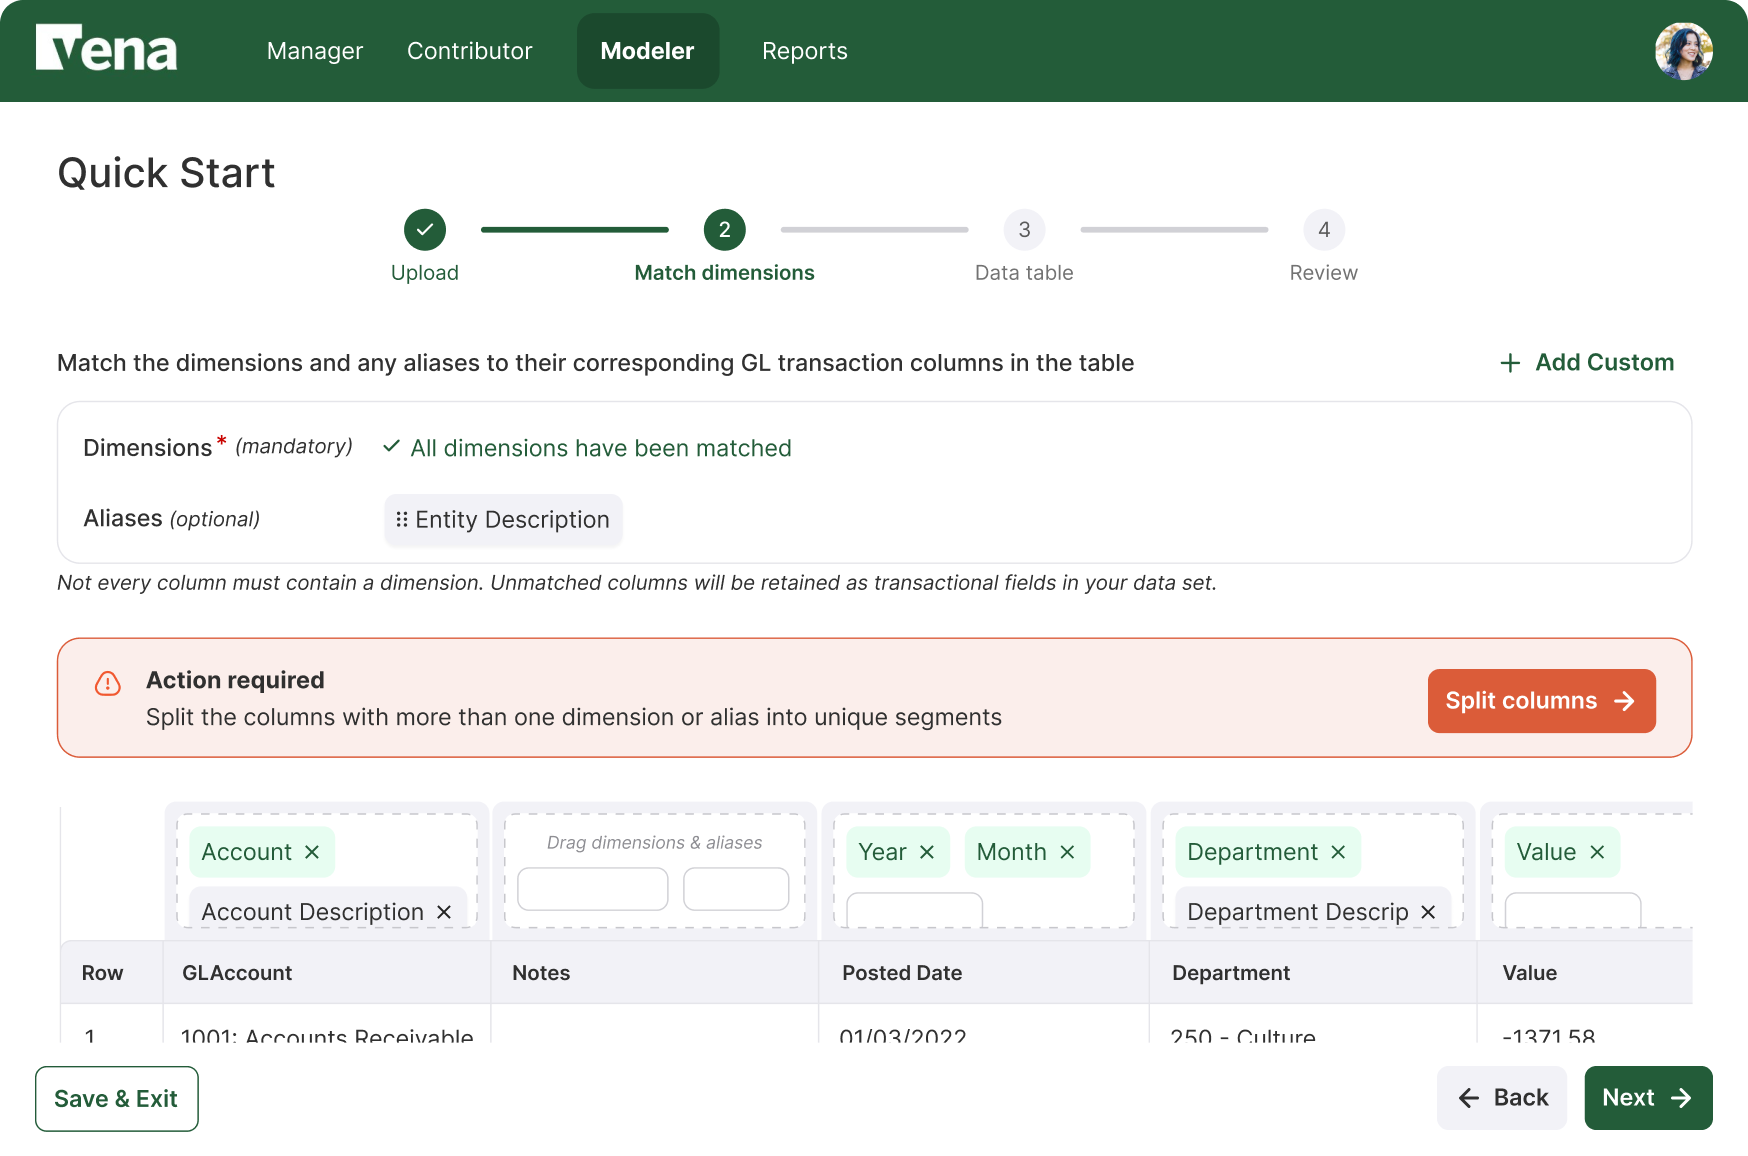
Once the mandatory dimensions are matched, if any columns contain multiple chips the user is presented with a secondary, conditional step to split those columns out.
An action-required alert guides users to split columns matched to more than one dimension or alias.
STEP 2: SPLIT COLUMNS
This step leveraged the same drag and drop matching pattern used in the first step, making it easy for users to understand what they needed to do. If there were too few columns compared to pills, they need to split them - a concept familiar to them thanks to Excel.
Users loved this feature and felt the experience was intuitive, quickly matching the pills to a column just like the step before.
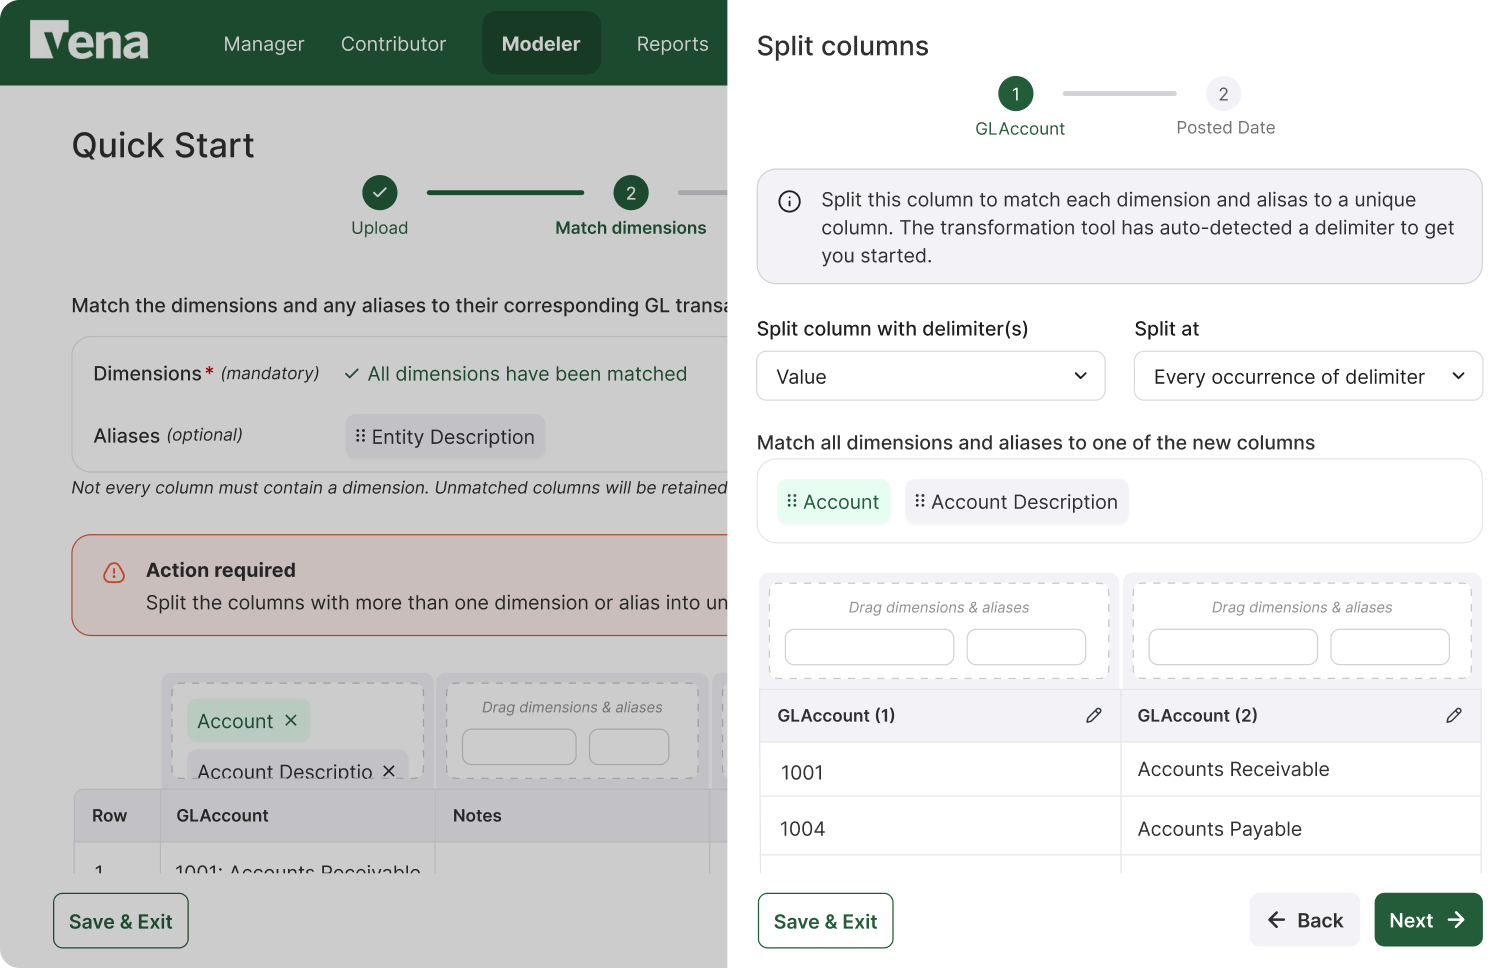
I added auto-detection of a delimiter to get the column splitting task started for the user as the drawer opened.
Drag and drop pattern matches the previous step.
Only one dimension per column ensures the column is split into enough parts.
An auto-detected delimiter starts the split, while familiar drop zones match each dimension to a new column.
STEP 3: REVIEW NEW DATA TABLE
The experience after columns have been split was important to get right so that users could understand exactly what their data would look like going forward.
I visually call out the new columns with a green underline, and grouped them with the original column using a container. This resonated with users and they were able to edit the column splits where needed.
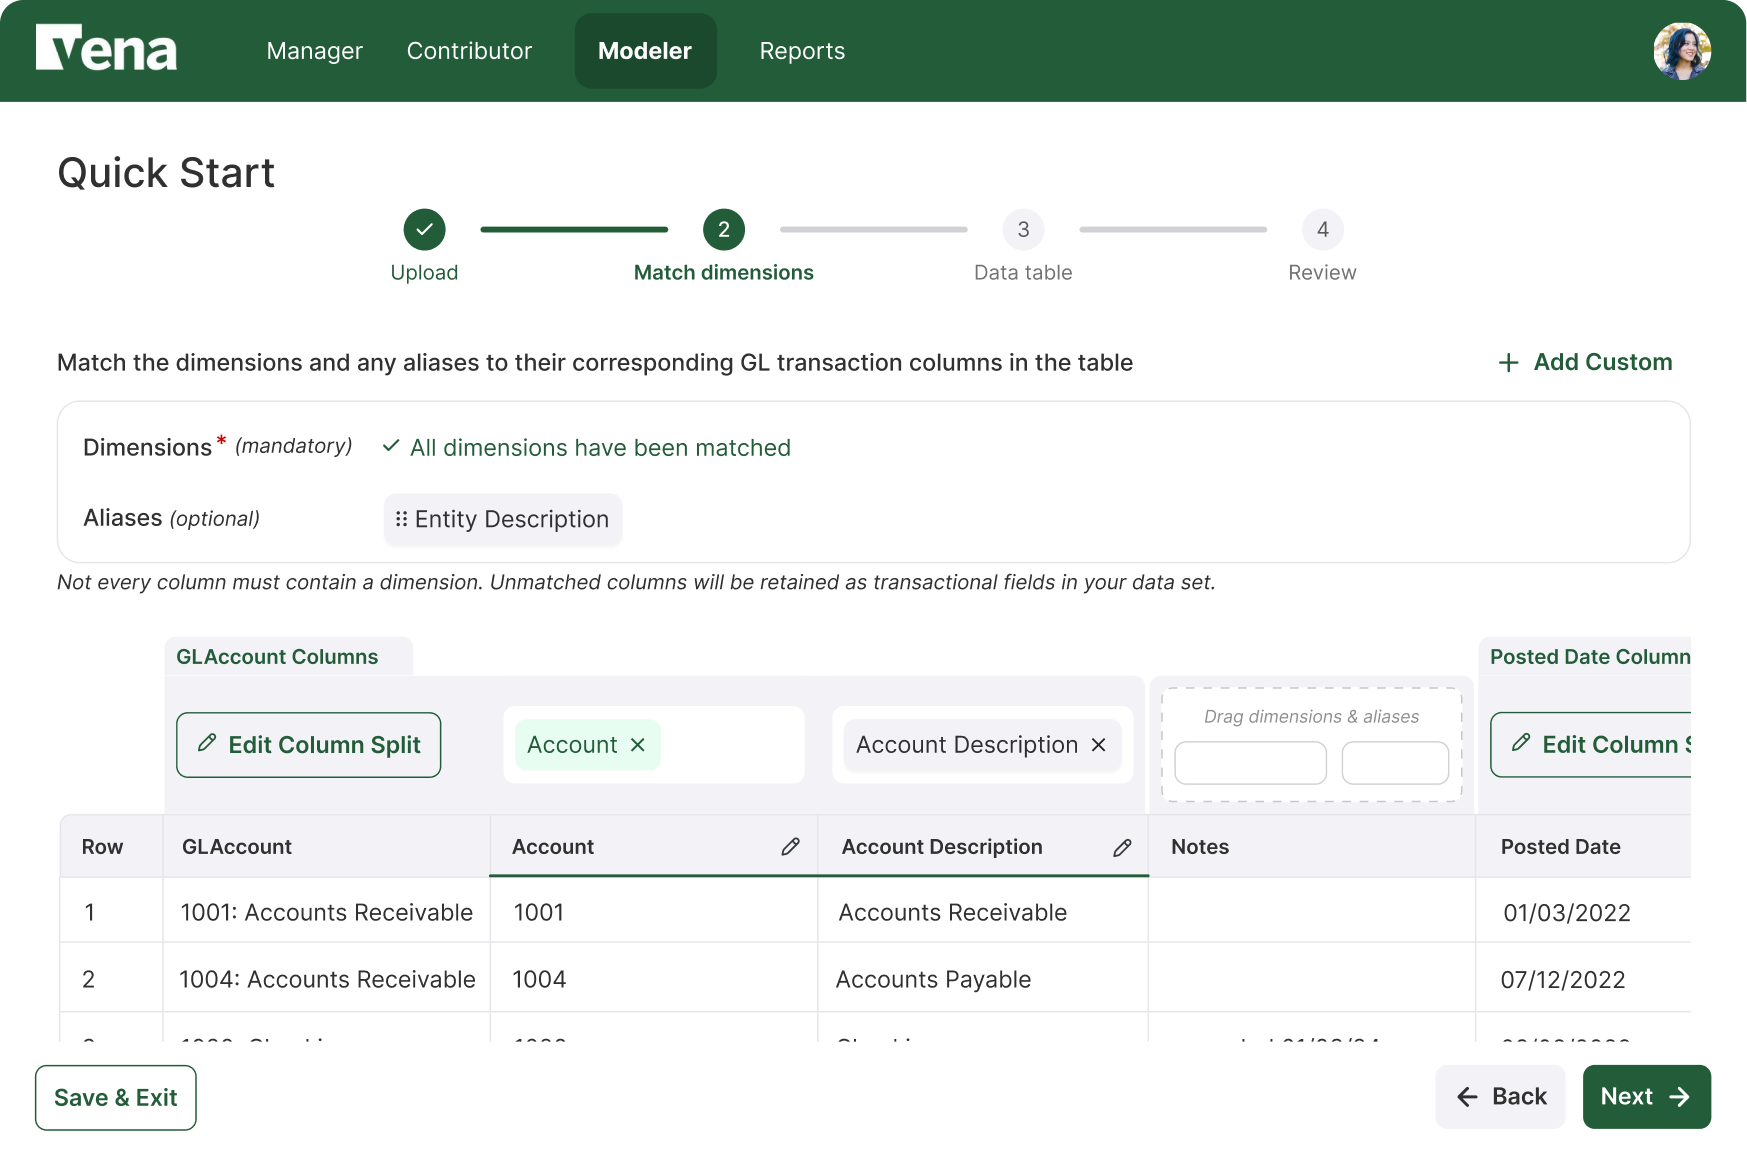
Split columns are visually grouped with the original column for ease of understanding.
Ability to edit column names in the main table in the drawer allows for workflow flexibility.
New columns are grouped with their original column and underlined in green, with an Edit Column Split option.
Outcome
an experience that feels like magic
73%
of new projects are leveraging QuickStart, vs. 60% target.
Enabled Vena Partners
to sell a new “fast implementation” package to close more deals with smaller and mid-sized, budget-conscious customers.
Set a new precedent
for future feature work that complex product functionality can be simple.
“The magic wand was the perfect icon to represent QuickStart because it truly feels like MAGIC! What’s really impressive is how it demystifies the entire process, making data integration more intuitive and accessible for power users.”